
One Hundred Years of Seismic Activity
This application was designed and developed by Esri's Applications Prototype Lab in Redlands, California. The application is built using the following technologies:
Earthquake data consists of 10,835 seimic events from 1900 to July 2015 with magnitudes of six or greater on the Richter scale. The data was downloaded from the USGS's ANSS Comprehensive Earthquake Catalog. Information on the largest and deadliest earthquakes was sourced from Wikipedia.
Seismic events hightlighted red in the chart indicate those events within a one year period, or half a year either side of the red line.
The souce code for this application can be downloaded from here.
Welcome to Quake Map. An application to browse more than 10,000 earthquakes in both time and space.
If you are new to Quake Map please click the tutorial button below for step by step instructions. The tutorial is accessible at any time by clicking the help button on the left hand side of the screen.
Please see the about dialog for data credit and a listing of technology used.
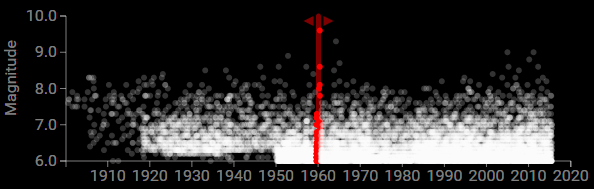
The quake chart is the primary tool for navigating a century of seismic events in both time and space. In total there are 10,835 seismic events represented between 1900 and late July 2015. The horizontal and vertical axises represents the date and magnitude of the seismic event.
The red graticule is used to select a subset of seismic events for display on the globe and information panel on the right hand side. The graticle can be repositioned by dragging or by simply click any other event on the chart. The selection window is one year, or half a year either side of the red graticle.
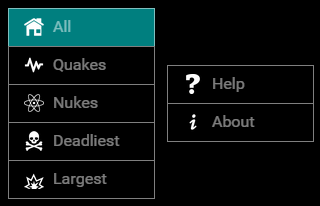
This menu primarily allows you to chart a subset of the 10,835 seismic events. As the name suggests, the Quakes and Nukes buttons will display only events relating to an earthquake or nuclear explosion. Likewise, the next two filters will show quakes with the highest fatalities and largest magnitude. The help button will re-launch this tutorial and the about button will display ditails about the data and technology used.
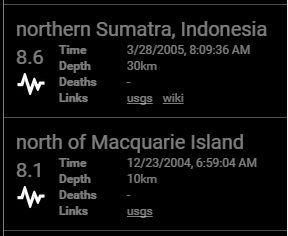
Lastly, the information panel presents tabular data for seismic events highlighted red in the chart. Events are ordered by magnitude and include details such as date and depth. The